Statistical Process Control (SPC) | The Solution to Plant Productivity You Have Been Looking For


Shamonique Schrick

What Is Statistical Process Control?
Simply put, SPC uses statistical methods and sampling programs to help plant and operations managers understand and control variability in their manufacturing processes. Charts highlight process variations in real-time, triggering alerts as processes begin to trend out of expected, standard limits. The main objective of statistical process control (SPC) is to manage operations better and reduce waste and rework. Plant and Ops managers benefit from SPC because it gives them the concrete information and clear markers needed to stop a line and fix problems before things spin out of control.
Putting SPC to Work in Your Manufacturing Facility
SPC relies on several methods for improving manufacturing yield and profitability, including using control limits. These limits keep the process runs well within specifications. If a process surpasses these control limits, it can trigger alerts even before the process approaches specification limits. SPC also relies on run rules and the interpretation of histograms and process capability measures (CPKs & PPKs).
While SPC does enforce control, it also adds another layer of value: by understanding variability, you can better understand your processes and targets to see what improvements you can make for greater efficiency.
Let’s take a closer look at some common SPC tools.
SPC Control Charts
Control charts are real-time monitors that illustrate how a process changes. These charts plot periodic samples over time. Types of control charts include:
Xbar (mean chart): This chart calculates the average values of a sample set.
Xbar-R (range chart): This looks at a sample size of two to nine data points.
Xbar-S (sigma chart): This chart is used for more than ten data points.
When manufacturers utilize these charts and control limits, they can see whether they’re operating within limits. SPC control charts also illustrate trends of variability. In some instances, increasing variability becomes apparent through an Xbar-R or Xbar-S chart, even though the mean chart is still on track. This finding could prompt you to investigate the root cause of variability further before the issue escalates.

SPC Control Limits & Run Rules
Control limits and control charts can work in tandem. These mechanisms leverage the natural variability of statistics to show the expected upper and lower boundaries of a process. Three sigmas on either side of the target (the six-sigma range) illustrate the upper and lower limits.
Managers can then use run rules to determine when a process has drifted and is no longer stable, based on the upper control limit, mean, and lower control limit. With SPC monitoring tools, you can set up alerts to notify you when you’ve violated a run rule. You can then assign unique responses to different run rules. For instance, violation of one run-rule may call for a temperature adjustment, while another one may require you to recalibrate machinery. Implementing run rules with control charts and limits allows you to stay on top of operations, keep processes under control, and minimize waste.
Histograms and Their Role in SPC
Histograms are an often overlooked yet valuable tool for SPC. These charts focus on control. For instance, you might use them to ensure you’re staying well within the control of customer specifications. Sometimes, customers may even request histograms as a tool to make sure their suppliers are doing their due diligence. Histograms can also be helpful for reviews and post-op analyses.
A histogram looks at process variation—the idea that a process has an inherent tendency to deviate. Process variation exists in all processes, both manufactured and natural. You can account for process variation by using tools to evaluate how much a process varies, considering the bell curve, and determining if the process is in control.
Of course, the idea is to have a narrow curve with shorter tails, illustrating more values within specification limits. If this process reveals outliers, you can drill down further to seek solutions for controlling the variation.
Process Capability Measures: CPK & PPK
Process capability measures allow you to understand the extent to which your process can conform to specifications. There likely will be some aspects of the process in some processes that will inevitably fall out of spec. CPK allows you to look at the variability of sample populations within standard deviations, while PPK measures normal process capability using the overall standard deviation.
If a CPK value is less than 1, it means that the process cannot meet specifications. However, high numbers also mean a problem and could indicate issues related to the target or variability. The ideal value for PPK is 1.33, which means 99.99% of all materials are within specification.
SPC Examples
SPC is useful in many types of manufacturing, but it’s a potent approach for streamlining operations in consumer package goods (CPG). These manufacturers face unique challenges, including the need to meet rigorous customer specifications while controlling costs. Here’s a look at how SPC can be applied in the CPG industry.
Optimizing Yield
Optimizing yield is a top-of-the-mind concern for many plant managers. Of course, yield optimization starts at the operator level—at the point of data capture.
Here’s an example:
Operators might regularly capture internal product temperatures. A temperature that is well over the limit could violate safety and regulatory requirements, but poorly controlled temperatures could also result in high costs by adversely affecting quality and yield. The goal is to create a safe product by achieving the optimal temperature without overshooting it.
Temperature variability can have a tremendous impact on product quality in food and beverage industry subsectors like baked goods. If the temperature for bread becomes too high, the product could bake unevenly and become misshapen or too low. Moving out of the optimal temperature zone raises the risk for raw or overcooked product or increased denseness. With cookies, elevated temperatures can lead to overspreading, whereas too low temperatures will lead to pale, under-baked goods.
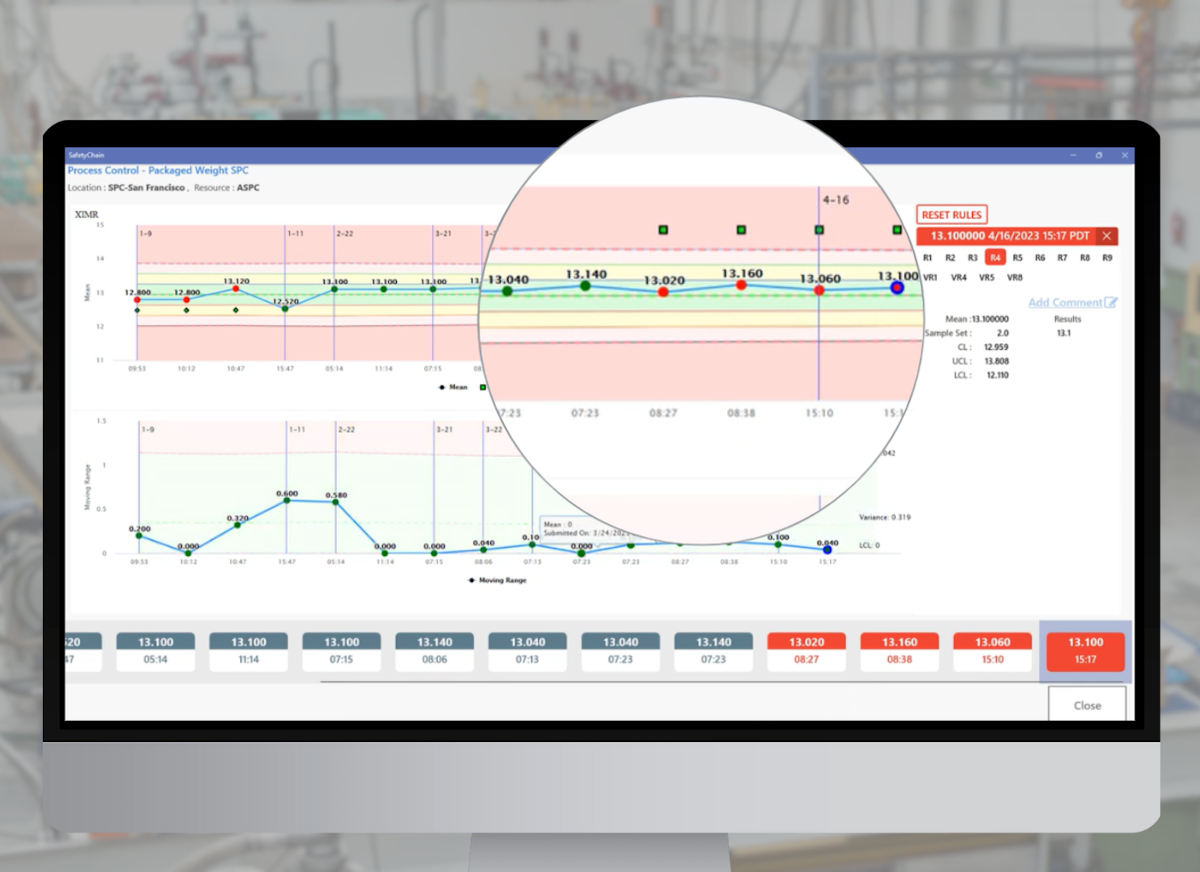
When manufacturers introduce an SPC tool such as SafetyChain, operators enter temperature data. If there is a specification violation, the software tool will trigger an alert. The operator can see on the appropriate control chart immediately which run-rule violations occurred. These violations appear in red, and the software prompts the operator to enter a comment. Management teams can then access the records, which will refresh in real-time. Software users can even review and sign off within the dashboard feature.
SPC Helps to Minimize Giveaway
Reducing giveaway is one of the greatest areas of opportunity for SPC, especially in the CPG industry. It’s easy for manufacturers to assign dollar values to package waste directly, but SPC software can identify weight values without operators having to enter the data manually. With real-time control limits, operators can ensure they’re meeting label requirements in terms of weight without giving away product. Should they violate an upper control, they can enter a comment related to the filler, packer, or another factor.
Operators can then use the software to roll up the data analysis to the management, which is useful for identifying the distribution of waste. For instance, if the data spread indicates you have some room to improve, you might consider re-targeting to reduce giveaway.
Perfecting Package Weight in CPG Products
Consumer packaged goods such as shea butter lotion present notorious packaging challenges. If the formula is too light or fluffy, it could require more volume to hit the package’s target weight. On the other hand, a product that’s too dense could lead to overfill or rework. Since there are many attributes to look at to ensure proper package weights, this scenario would call for multi-attribute control—you could measure pH viscosity, among other parameters, to ensure you’re meeting both ends of the requirement.
As another example, a CPG company might have fruit fillings that would need to maintain the proper pH, temperature, and viscosity. Hot fill must stay within the proper temperature to sterilize the packaging, but this particular issue and other factors will also affect the product’s quality. Operators can use different charts to track these critical metrics in real-time to ensure the right consistency and temperature, among other factors.
What is SPC Software?
SPC software should offer several types of customizable control charts that you’ll set to monitor precisely what is relevant to your process. Automating this data collection also means customized notifications alert operators and managers right away when a spec deviation occurs, vastly reducing waste through non-compliance. Both large and small productions can have multiple issues crop up at the same time, and operators can set SPC software to prioritize issues.
Sure, managers can—and do—perform SPC manually, but this can be extremely time-consuming and will detract from response time when compliance issues arise. Implementing SPC software allows managers to create easy-to-read graphs and reports. Because the software crafts the graphs based on all relevant data gathered in real-time, operators and managers can execute informed decisions and respond to quality and specification issues much faster.
Key features of SPC software:
Customization of specification ranges
Automated alerts
Real-time tracking of production
Dashboards for plant visibility
Building an SPC Program in Your Plant
Here are steps you can use to implement SPC in your plant:
1. Identify Attributes
Ask yourself:
How can we impact performance?
What are the data points that will allow us to do so?
What is our improvement goal
2. Establish a Sampling Program
Next, determine where you’ll find the data:
How will you deploy and monitor the program?
Who will be responsible for carrying out the program?
Which tool setup and maintenance steps will be involved?
3. Monitoring & Control
Decide:
Which control charts will you use to perform active monitoring?
Review these control charts with your teams to make sure you’re on track.
4. Analysis
When it comes to analyzing your data:
Remember visibility and share-ability are key
Return to your goals and determine whether you’ve hit them or missed them
Revisit any approaches as needed
Troubleshoot any quality issues you identify.
Is SPC Really that Important?
There are many reasons why so many companies have adopted SPC or are working to integrate SPC. One ever-present issue for many companies is the constant threat of contamination. As companies grow in scale, it can be challenging to tightly control all aspects of the process, from raw ingredients to the consumer. In fact, there are very few reasons not to adopt SPC for most companies. The most cited reasons as to why companies hesitate to implement SPC include:
Resistance to change—we’ve always done it this way!
No management support—see bullet #1.
We don’t understand statistics—SPC would be confusing.
Fortunately, companies can answer these legitimate concerns by implementing SPC software. While it is always useful to understand the statistical methods behind the calculations, the software can eliminate potential confusion and human error by creating charts that everyone in the process line can understand and use. Software companies like SafetyChain deliver user-friendly programs from the top down and include comprehensive and intuitive dashboards.
Change is difficult, and even with the proper SPC software, companies will still need to embrace a shift in thinking. SPC implementation allows companies to react faster and become more proactive in integrating the latest industry standards and answering to customers. When considering SPC or when pitching to ramp up use or bring in software, managers should focus on:
Ease of compliance through automation
Increased productivity and decreased variability
Creating a clear vision and mission that helps everyone in the process to be on the same page.
As you begin your journey into SPC, you might also consider asking around your plant to see if anyone has familiarity with the method. You might discover some helpful insights, and employees with previous experience might also be willing to take some degree of ownership over the initiative. Creating a plan for holistic deployment of SPC is key to facilitating the transition so you can hit the ground running. A strong plan makes it easier for managers and operators to become comfortable with the changes and understand the end goal.
To watch the webinar replay of Putting SPC to Work in Your Manufacturing Plant.